An attentive eye
An attentive eye: watching the development of the phytoplankton bloom from above their heads.
Working in co-operation
It is early morning, scientists on the ice camp and the Amundsen research vessel are finishing their breakfast and getting ready for a long day of fieldwork. This is also the time when Maxime Benoît-Gagné sits at his computer and visits websites from space agencies, runs codes that would appear like ancient language to the non-initiated, downloads the latest satellite images and processes them. Scientists in Qikiktarjuaq or aboard the Amundsen carry out their daily activities oblivious of the satellites that fly 800 km or so over their heads, collecting thousands of images over an area that can be as big as the Baffin Bay in a matter of seconds. This information is unique and its value will be increased when tested against in situ data .
Space data from … several and specific satellites
But for now, Maxime is collecting data from several satellites; each has its own specificities.
Satellites with radar technology
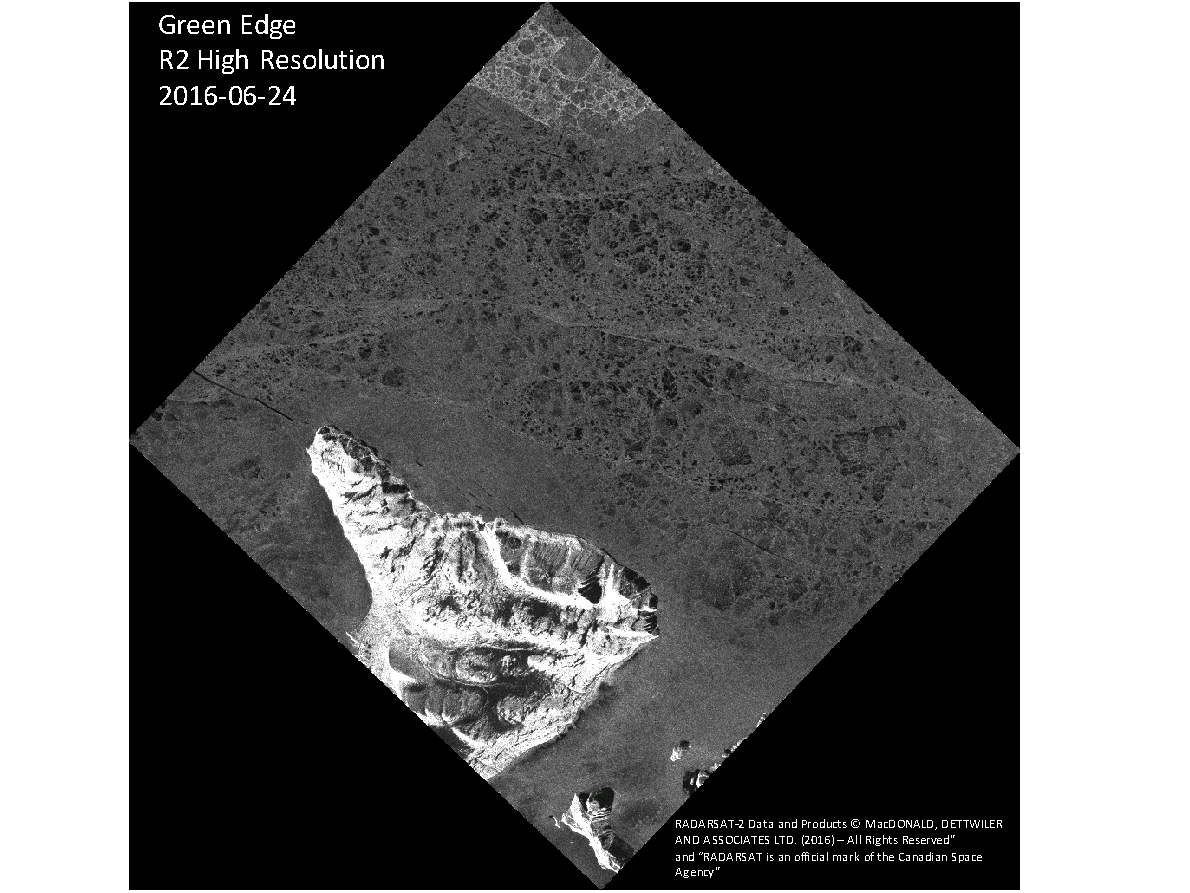
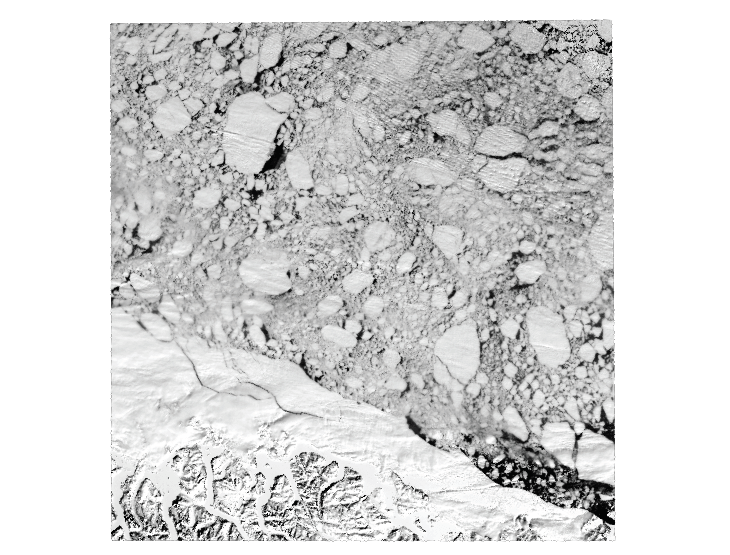
With the help of the Canadian Ice Service, images from the Canadian RadarSat-2 platform are collected over the ice camp near Qikiqtarjuaq with an 8 m resolution (Figure 1), these data complete the information collected by the Sentinel-1 radar satellite from the European Space Agency (ESA), which has a resolution of 100 m on the ground (Figure 2).
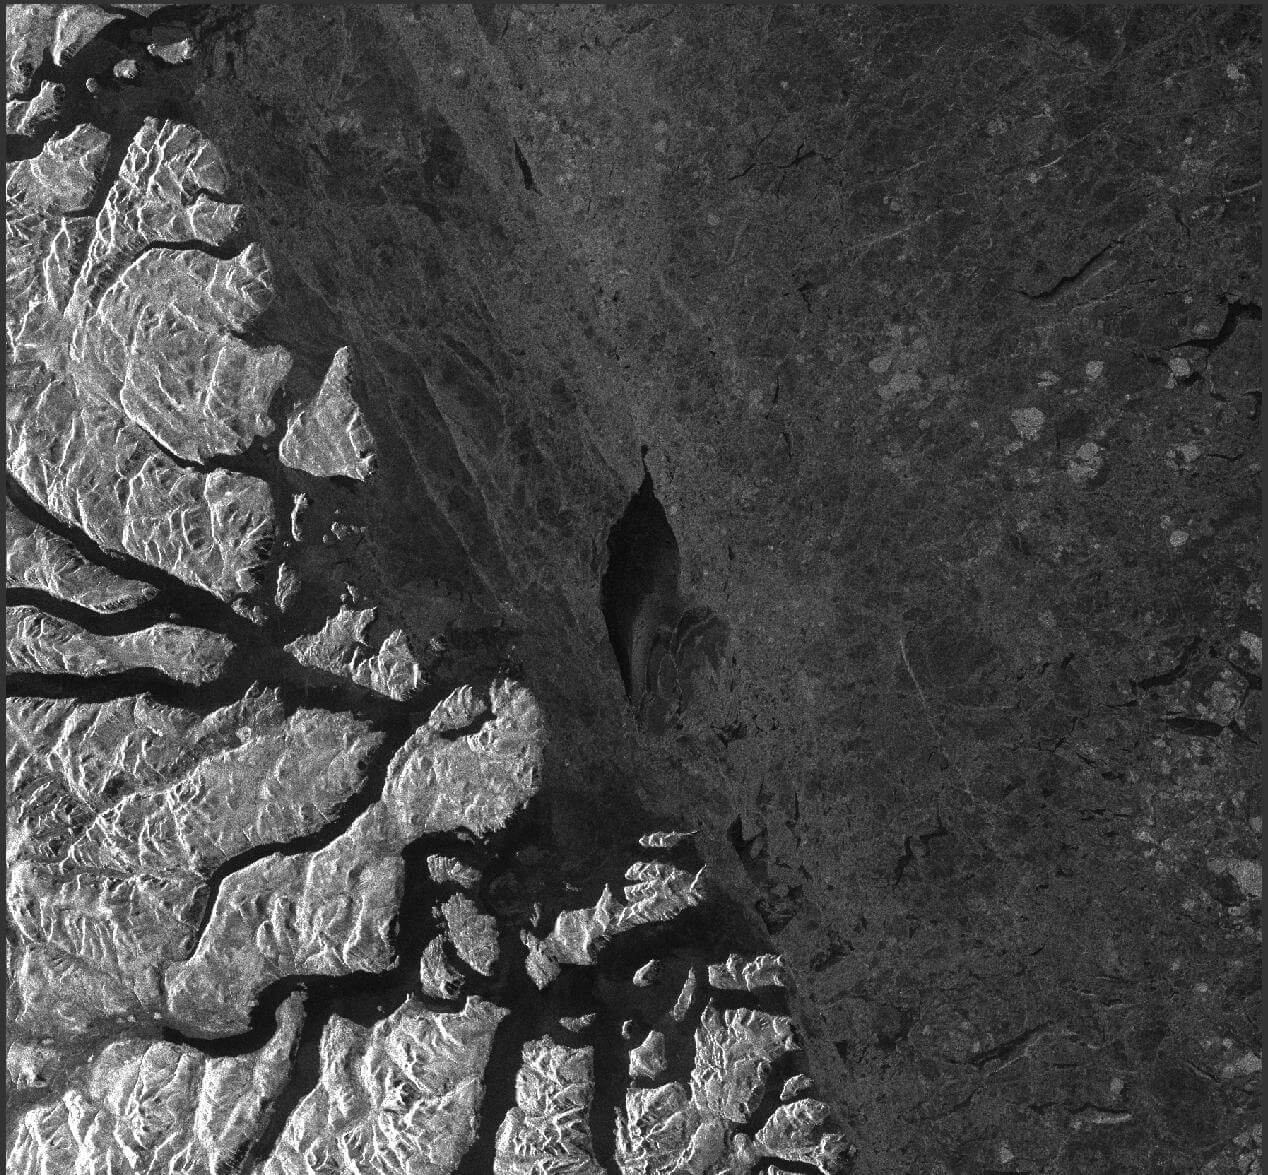
These two satellites are part of the Synthetic Aperture Radar family and they provide information on sea-ice, namely, its location, its structure (“smooth” or “bumpy”) and its age (young ice, first-year or multi-year ice). They are very useful to inform scientists in the field about their environment, sometimes as close as a few kilometers, for both scientific purposes and security. Despite their very high ground resolution, the limitation of such satellites is their low frequency of revisiting time (3 or 4 days, sometimes more).
Satellites with microwaves technology
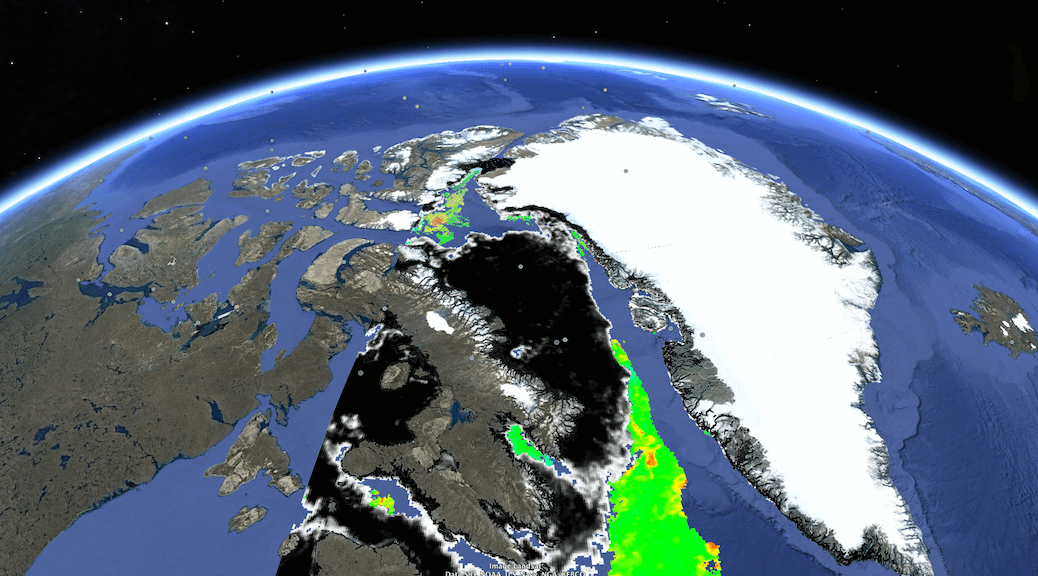
Therefore, we also use other satellites, that do not rely on radar technology but on microwaves (around 90Ghz compare to the 2.5Ghz of your microwave oven). Such satellites, as the AMSR2 (from the Japanese Space Agency, JAXA), provide daily information on sea-ice concentration with a resolution of 3.25 km, not enough to describe the environment surrounding the Amundsen in detail but sufficient to describe the sea-ice dynamics in the entirety of Baffin Bay and to follow the ice edge (Figure 3).
But that’s enough about sea-ice, what scientists are really tracking during Green Edge is the response of phytoplankton to receding ice as sun light increases in the Arctic Ocean.
Radar- and microwave-based satellites have the advantages of “seeing” through the clouds, however, their radiation waves stop, or rather bounce, at the sea-surface and do not provide any information about what is happening in the surface layer of the ocean (few meters to few hundred meters… in the tropics!).
Ocean Colour satellites
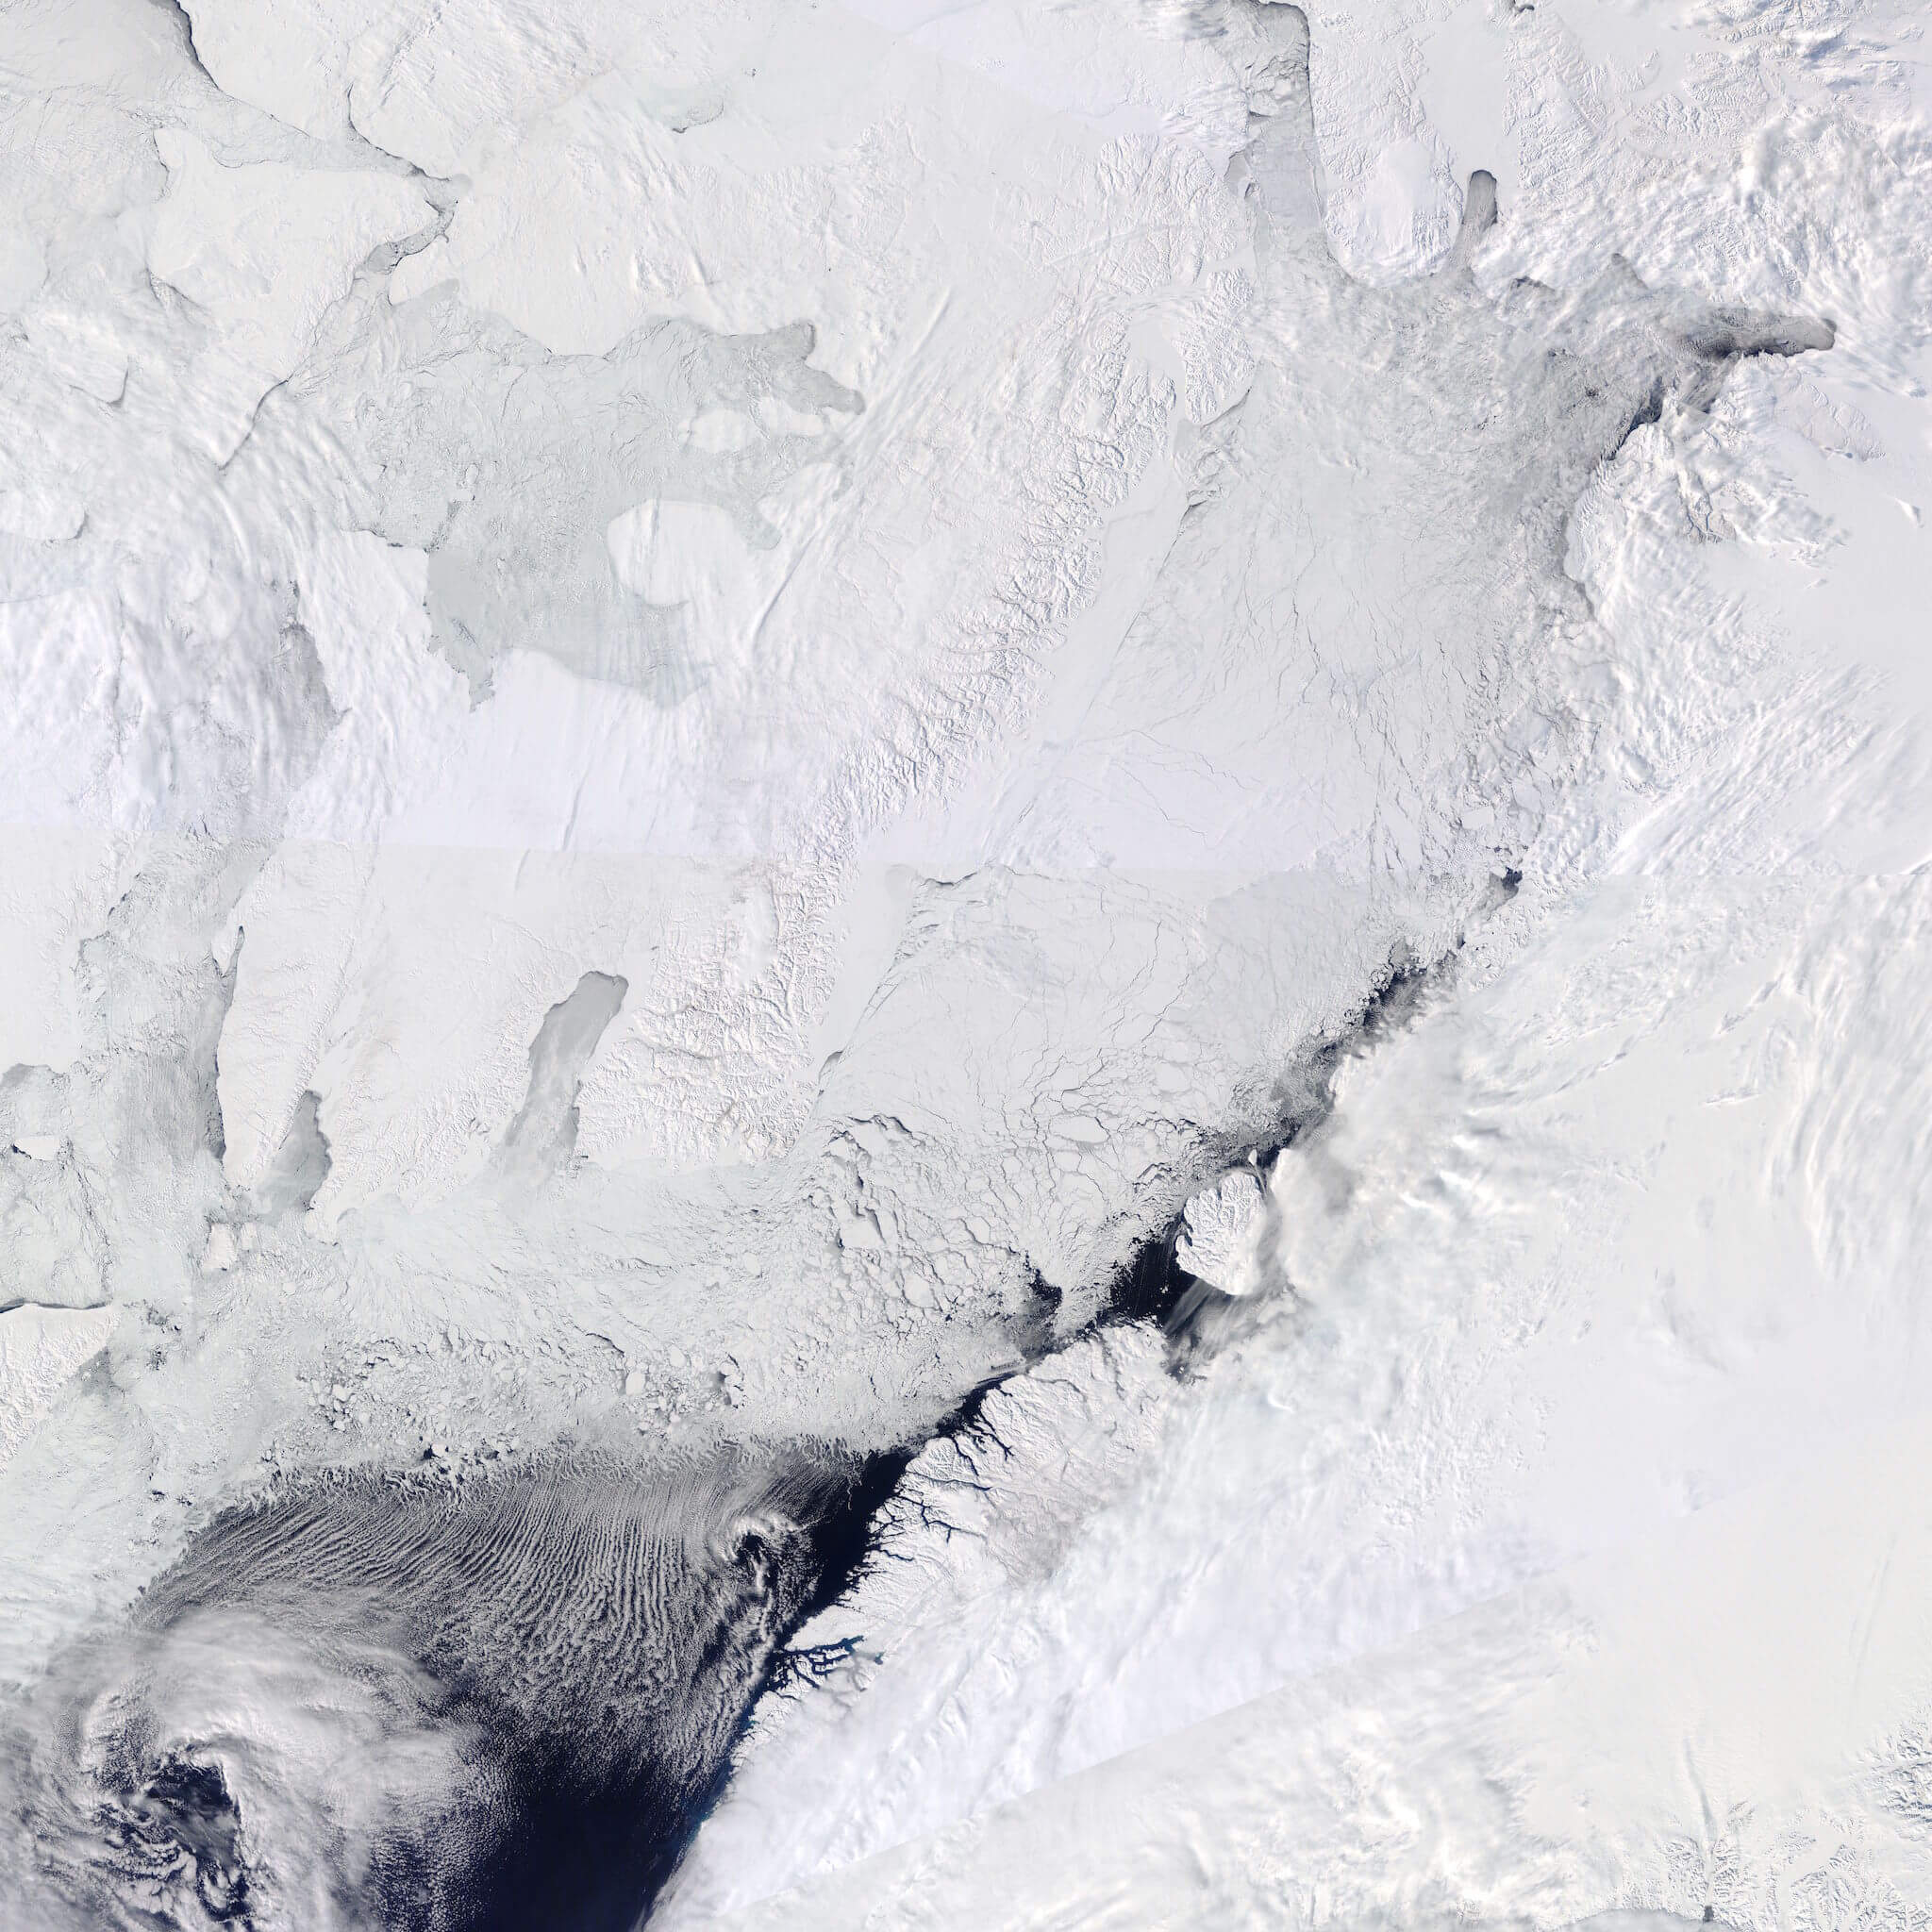
Ocean Colour satellites really measure the colour of the ocean: it seems trivial! But the products that are derived from these pieces of information obtained at different wavelengths (i.e., colours) provide information on the biomass of phytoplankton and other marine constituents (e.g., mineral particles). Briefly, the more biomass, the greener the water. On a daily basis, and when clouds are not obstructing the “view”, images from MODIS (1 km resolution, NASA, Figure 4), Landsat (15 m resolution, NASA, Figure 5) and Sentinel-2 (10 m resolution, ESA) are processed, meaning atmospheric contribution is removed and colour from the seawater is translated in to phytoplankton biomass, to obtain maps of phytoplankton concentration and production. All this information is summarized in daily reports, some maps are also generated in “google-earth” format (i.e., kml) for easy use and interpretation by scientists. They are sent by internet connection to Qikiqtarjuaq and the Amundsen. This precious information will be used either for security purposes (e.g., open-water near the camp) or for sciencitfic purposes (e.g., should we reroute the ship towards an opening in the ice where phytoplankton thrives?).
These satellite data are archived by Takuvik’s remote sensing group at Université Laval. All the above-mentioned satellites, or similar ones, have been flying for decades such that the studies of long time series of sea-ice and biological properties reveals crucial information on the changes that are occurring in the Arctic Ocean as a result of global warming. Field studies, such as the Green Edge campaign are extremely valuable to understanding the mechanisms associated with sea-ice retreat. The knowledge that is acquired during Green Edge will be directly translated into satellite applications that can be extrapolated to the entire Arctic Ocean.