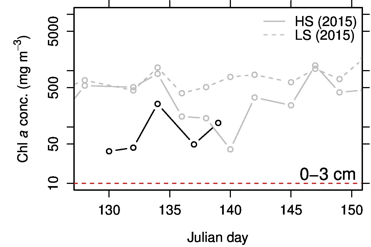
Figure 1. Chlorophyll a (chl a) concentrations as a function of day in 2016 (black) for 0-3 cm from the bottom of the ice. Data in 2015 are also shown for comparison (grey).
Figure 1. Chlorophyll a (chl a) concentrations as a function of day in 2016 (black) for 0-3 cm from the bottom of the ice. Data in 2015 are also shown for comparison (grey).