Ever heard of the Keeling Curve? It is the earliest continuous time-series of atmospheric CO2 concentrations, measured by the scientists Charles David Keeling in Mauna Loa, Hawaii. It was the first evidence that atmospheric CO2 concentrations were rising year after year, and it was the first indication that human activities may be responsible.
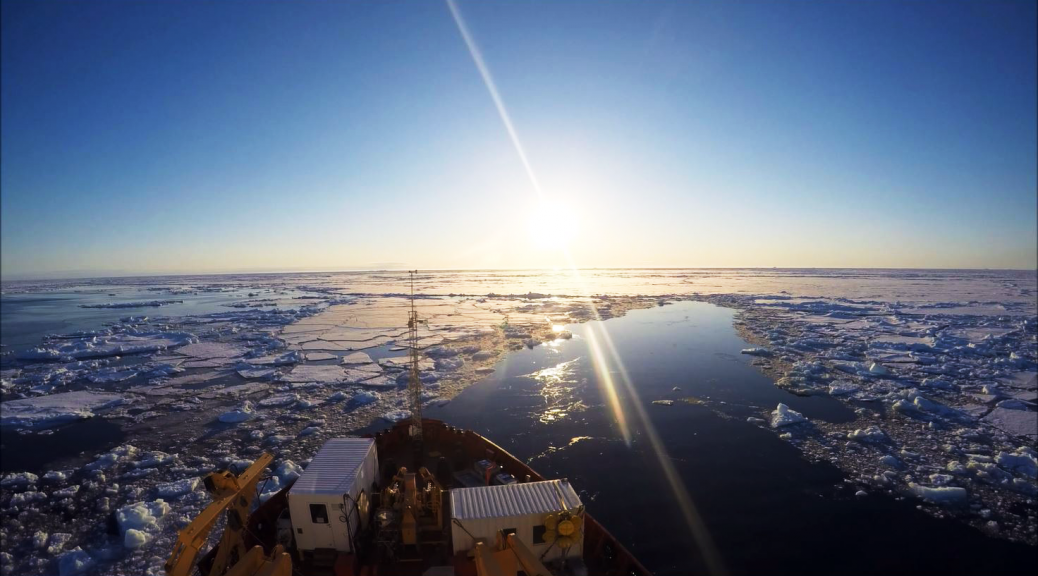
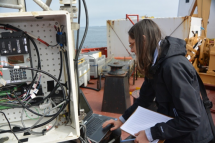
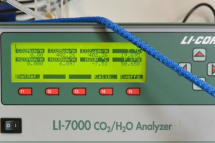
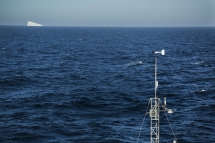
My name is Tonya Burgers – I’m a PhD student at the University of Manitoba. My job on-board CCGS Amundsen is to study the carbon dynamics of the Arctic Ocean, and similar to Charles David Keeling, I am maintaining a record of atmospheric CO2 concentrations throughout the Amundsen cruise in Baffin Bay. I am able to do this using a meteorological tower installed on the foredeck of the ship, and a CO2 analyzer. The tower holds an inlet high above the deck of the ship, and a pump connected to the CO2 analyzer pulls air down the tower and into the instrument.
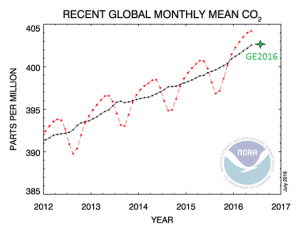
For most of the cruise the CO2 analyzer has been recording concentrations between 400 and 405 ppm. However, sometimes the instrument starts to drift and records values far above or below this range. This is when I need to calibrate the CO2 analyzer. I complete calibrations using gas tanks of nitrogen gas, and CO2 gas with a known concentration. I first flow nitrogen through the instrument, and tell it that this gas has a CO2 concentration of 0 ppm. Then I connect the CO2 tank (which has a concentration of 455.7 ppm). The instrument is able to use these two concentrations to create a calibration curve, which it can compare all future measurements against. When I’m finished, the CO2 concentrations are back in their proper range!
So today’s measurements are showing an atmospheric CO2 concentration of 402.26 ppm right after my calibration. Comparing this to the global monthly average CO2 concentrations published by NOAA, it seems I am right on track!

