After 10 days of hard work the camp was completely set up and the Green Edge team could finally focus on science related activities.
One important aspect of our research involves the study of the physical characteristics of the water column. The water column is a convenient concept that is used to evaluate the stratification or mixing of the thermal or chemically stratified layers in a lake, stream or ocean. In this case, we are interested in characterizing the ocean at different depths beneath the ice. The study aims to describe the variation of these characteristics as the ice conditions changes from thick ice to open water as the spring sets in.

Three variables are estimated essential for this matter: conductivity (which ultimately gives us salinity), temperature and depth. Together they give name to the instrument used to measure them, the CTD. This is a very important tool in oceanographic studies, which also has a very interesting history due to its technical challenges. Interested in making your own CTD from scratch? visit the OpenCTD project.

A CTD cast or profile is a high resolution collection of data representing the measurement of these three variables as the sensors dive down and come back up from from a specific depth. The data are recovered once the instrument is out of the water and displayed conveniently in curves so that they can be interpreted quick and easily. More sensors may be added to the instrument to increase the number of variables in the water column being studied. For instance,our CTD instrument includes additional sensors as a fluorometer which outputs the level of cholorophyll a and a PAR radiometer which indicated the level of photosynthetically active radiation.
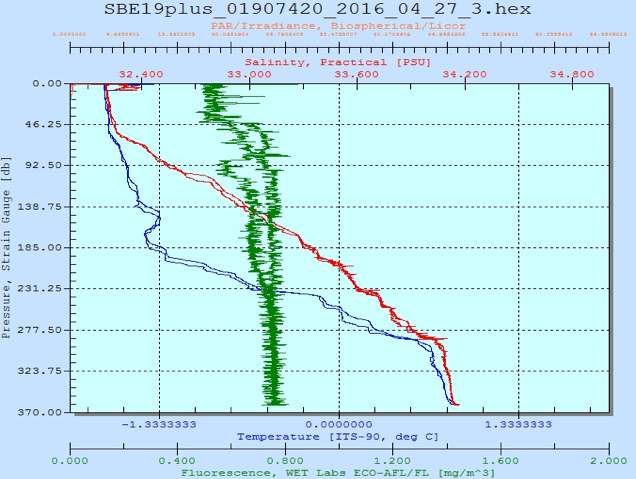
Above is an example of a CTD profile in which temperature is represented by the blue curves, salinity by the red curves, chlorophyll a by the green curves, and the PAR by the orange curves. This profile was collected at the ice camp on April 27th 2016. The top 50 meters are well mixed cold Arctic water reaching freezing conditions. The profile also shows a warmer and saltier 100 m thick bottom layer of water originating from the Atlantic Ocean. Some may think it is strange to observe an increasing temperature gradient toward the bottom of the ocean as cold water is heavier than warm water, but the density of the water in ocean is driven by its salinity that presents an increasing gradient toward the bottom. As for the low chlorophyll a concentration, which is used as a phytoplankton biomass indicator, the profile does not present apparent feature as life under the ice cover is still overwintering.
On site, oceanographers are very excited to analyze the CTD profiles to determine at which depths to sample seawater based on the physical, chemical and biological stratification of the water column. For the GreenEdge project which aims to study the phytoplankton spring bloom (PSB), we conduct a temporal survey of the changes in the top 60 meters of the ocean collecting water at 6 depths (underice, 1.5, 5, 10, 20, 40m).

Sampling with Niskin bottles is performed immediately folowing a CTD profile to collect information at selected depths. Plastic Niskin bottles have caps that are either spring-loaded or held under tension by an elastic rope. They are lowered on a cable into the water column, then a weight or messenger is dropped along the cable, which impacts the bottle, starting the mechanism that will seal the bottle, trapping the water sample inside. The water-filled bottle can then be brought up to the surface. The water sample is distributed to scientists working in the laboratory in Qikiqtarjuaq who study its contents. However this will surely be the topic of a future post.
Text: Jose Lagunas and Joannie Ferland

Amazing website. A lot of useful info here. I’m sending some friends and also share tasty. And, of course, thank you for your hard work!
Managed Network Services Dallas
Thanks for another great article. Where anyone written such a perfect way of that kind of information might be? I have a presentation next week, and I’m on the search for such information.
Managed Network Services Dallas
One of these technologies is that I’d like to be able to use for myself. It is definitely a cut above the rest until my provider and I can not wait to have it. I need your insight. Thanks
Managed Network Services Dallas
This is very serious, you’re collaborating on passing the author. In addition, along with your feed and I actually signed up to your personal unbelievable write ups can enjoy. By the way, we’ve shared our social network in the Journal of the net.
Managed Network Services Dallas