Tag Archives: Phytoplankton spring bloom

Beyond expectations

Building up a large multidisciplinary project like Green Edge takes years. Our first proposal for getting funding support was submitted in early 2013, and then many others were submitted to various French and Canadian funding agencies and foundations over the following 2 years to reach the amount of money required to undertake this endeavour. The logistical planning of the 2015 and 2016 expeditions started during late fall 2014. The ambition was very high, the number of unknowns elevated, and the risks huge. The target of the Green Edge field program was to describe the phytoplankton bloom and all related aspects at unprecedented time and spatial scales.

Figure 1. Sketch of spring bloom progression in marginal ice zone according to Wassmann et al. 2006 (left panels) and future scenario with thinner sea ice (right panels). The green color represents phytoplankton in water column and red illustrates sea ice algae. Modified from Wassmann et al. (2006).

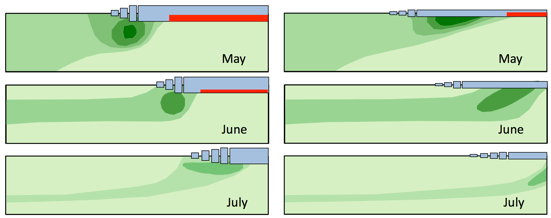
Even a carefully designed conceptual framework and perfect logistical preparation (which was nearly achieved) were not enough to guarantee success in reaching our target. Mother nature had to be with us too! Indeed, blooms do not always occur at the same time of the year and in the same spot. Their extent and magnitude vary from year to year. The cruise plan is based on a conceptual design of the sampling strategy, which is derived from a conceptual model of the phenomenon under study that take the form of simple diagrams such as :

Figure 2. Map of Baffin Bay showing an example of sea ice distribution and chlorophyll concentration with a typical ice-edge bloom during early July 2010. The pink line in the middle shows the transect along which samples will be collected from the research ice-breaker CCGS Amundsen. The star indicates the position of the ice-camp. The other two pink lines show the transects to be sampled with underwater gliders. The yellow dots illustrate examples of the positions for profiling floats. The grid shown in the zoom will be covered with the AUV.

Often, reality turns out to be quite different from the conceptual approach. Things do not happen in the field as initially planned. Many compromises must be made to compensate for unexpected conditions (more or less ice, bad weather, scientific equipment failure, …). There may also be little or no bloom in a particular year. Scientific objectives often need to be readjusted a posteriori to the data that were collected.

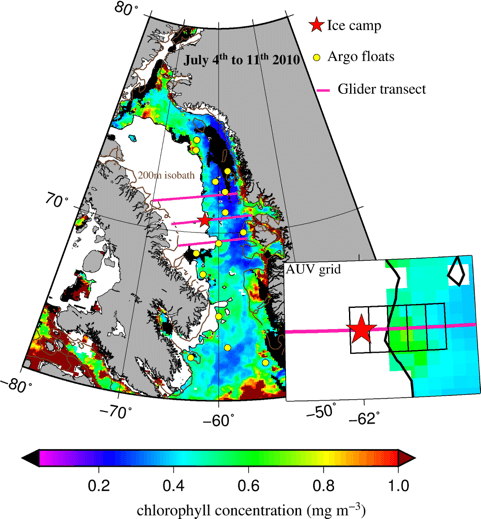
But as the scientific leader, I can now claim that the Green Edge consortium reached its objective and that the field expeditions were fully successful. We documented spring blooms in both 2015 and 2016 according to plan. The bloom occurred when and where, and to the extent we expected. I can even say that we surpassed our expectations. We documented the bloom more intensively than initially planned and the initial data appear to be outstanding. The information that we acquired will provide an unprecedented increase in our understanding of this important natural phenomenon, its impact on the Arctic food web, and its evolution over the next decade.

Time for great science now!

Marcel Babin

Instrumental zoom: the LOKI system

As part of the Green Edge 2016 campaign, LOKI – The Lightframe On-sight Keyspecies Investigation system – is being deployed from the CCGS Amundsen with the goal to study the coupling between phytoplankton and zooplankton.

LOKI is an underwater camera system for continuous, in-situ imaging of zooplankton (Fig. 1). During a LOKI deployment thousands of images of plankton ranging from 200 µm to ~3 cm are collected as well as environmental data from the onboard sensors (e.g. pressure, temperature, salinity, chl a). LOKI data has a vertical resolution of ~50 cm, therefore providing a much more detailed picture than can be drawn from traditional zooplankton net samples.

Figure 1. a) Schematic of LOKI showing its main components 1-4. b) The LOKI system on the right attached to a frame besides a traditional zooplankton net sampler, during a recent deployment in the Canadian Arctic. c) The LOKI camera, showing how plankton pass through the channel for imaging. a and c are adapted from Isitec GmbH. Photo credit for b): Jessy Barrette. Figure taken from Schmid et al. (2016).

Images collected by LOKI are high enough resolution to identify development stages of copepods or even mating copepods (Fig. 2).

Fig. 2: LOKI images of selected zooplankton taxa. Figure taken from Schmid et al. (2016).

Using the model developed in Schmid et al. (2016), we are now capable of automatically identifying LOKI images. In the case of copepods, identification can be as detailed as the stage level.

Moritz Schmid

Read Schmid et al. (2016) on researchgate.

To find out more about LOKI projects, follow: schmidscience.com

Reference: 

Schmid, M.S., Aubry, C., Grigor, J., Fortier, L. (2016): The LOKI underwater imaging system and an automatic identification model for the detection of zooplankton taxa in the Arctic Ocean. Methods in Oceanography, http://dx.doi.org/10.1016/j.mio.2016.03.003.

Being a pilot in the Arctic – interactive update!

Click here to see the update!

Let’s have a look into the difficulties of operating high-tech equipment in the Arctic environment. But I don’t mean airplanes; I want to talk about flying a remotely operated vehicle, an ROV  for short, in the water column beneath 1.5 m thick of landfast ice.

Continue reading Being a pilot in the Arctic – interactive update!